Click on one of the "SEE PACKAGE" buttons above to see the details for that option. Please contact us for additional options that suite your application.
We offer a free tier, where one reading per day is provided. Data frequencies as granular as 1x/minute can be provided with an additional monthly fee.
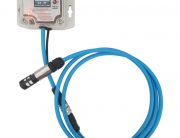
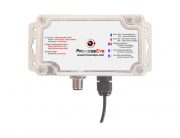
The goal is to make installation as simple as possible. There are various options for the temperature sensors with the first option being submersible sensors. These can simply be placed in the distribution deck and basin with no mechanical installation required. The second option are surface mounted probes that can be placed on the surface of a metallic pipe, underneath insulation. The third option would be to 1/4" MNPT sensors into a 1/4"FNPT fitting. The last option would be for an existing temperature sensor/system to send its 4-20mA reading to a RemoteLobeTM. If the enhanced Package is chose, we supply a strap-on ultrasonic transit-time flow meter that gets mounted on the surface of a pipe, or an existing flowmeter/system 4-20mA sensor can be utilized. The AmbiAirTM device just needs to be located outside.
Absolutely. Users can send 4-20mA signals for the fan speed (i.e. Hz or %) and/or an anemometer reading to a RemoteLobeTM so these can be incorporated in ProcessCentralTM to see the effect of these variables on the Cooling Tower Efficiency.
A good summary can be found here but generally speaking the "Wet Bulb" temperature is the temperature at which the air is saturated. This is important in cooling tower or evaporative processes because the wet bulb temperature is the theoretical coldest temperature a cooling tower can lower the water temperature to. So, for example, if the wet bulb temperature was 82F, the coolest a cooling tower basin could possible be is 82F (it will actually be higher because attaining the wet bulb temperature would be difficult and not very efficient).
Most cooling tower applications are controlled based on a set-point for the basin temperature. However; in situations with high wet bulb temperatures the set-point may never be able to be reached, yet all cooling tower fans are on 100% and resulting in a waste of energy.
Yes, we use a proprietary algorithm to determine the wet bulb temperature without the need for a sling psycrhometer or any other complicated device.
A standard formula is used to determine the Cooling Tower Efficiency (CTeff).
CTeff = (treturn - tbasin) / (treturn - twb) * 100
The ProcessEyeTM ecosystem uses standard WiFi, which enables the sensors and RemoteLobesTM to be dispersed throughout a facility. They can be granted access to a Guest-WiFi network, or a separate cellular modem with a hotspot can be used to gain access to the internet.
Absolutely. We have allowed users a robust reporting package in ProcessCentralTM that allows them to generate custom reports on a frequency that is desirable to them (i.e. daily, weekly, or monthly).
Security is one of our key priorities and we use the most advanced encryption technology available to ensure secure communications.
Our ecosystem uses a blend of computing logic that occurs in our RemoteLobesTM as well as ProcessCentralTM, so at this point we don't make the information available to be incorporated into existing infrastructure. We also believe that there isn't much value in bringing this data into existing infrastructure due to the cost, complexities and lack of automated reporting. Without the reporting capabilities the same "forgotten" condition will develop and users and organizations won't be any better off.